The S&P 500 has reached yet another record high, but the market may still be forming a topping pattern.
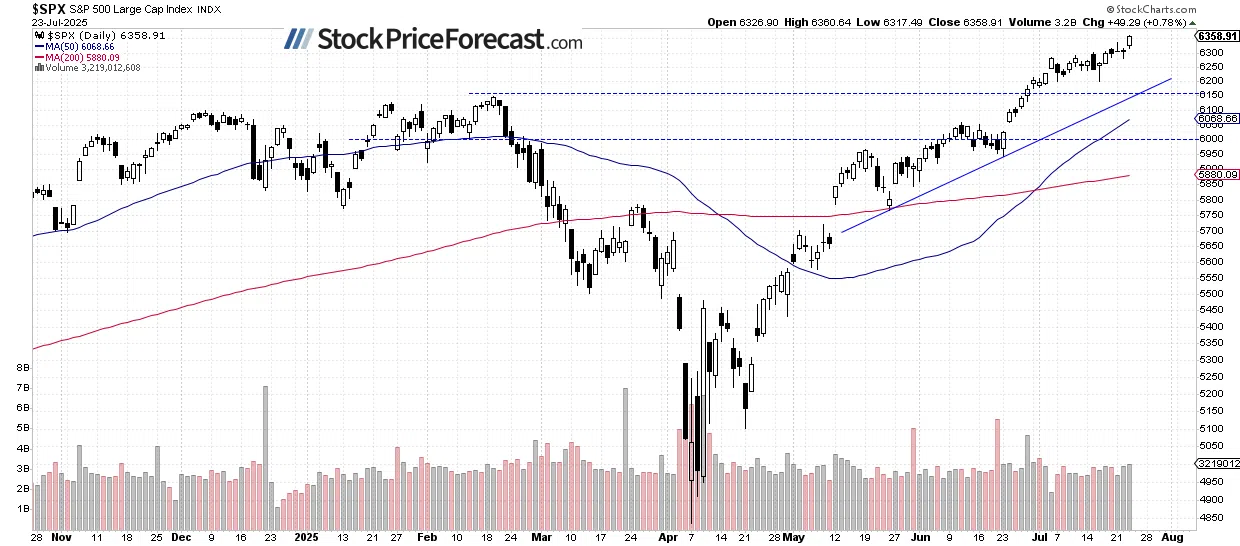
Stock prices reversed Tuesday’s slight pullback, reaching new record highs on Wednesday despite mixed sector performance, including weakness in tech stocks. The S&P 500 set a new record at 6,360.64 and closed 0.78% higher.
This morning, the S&P 500 is expected to open virtually flat following mixed earnings results from major tech names like GOOG and TSLA. After yesterday’s strong advance, some short-term consolidation is likely.
Investor sentiment has slightly deteriorated again, as reflected in the yesterday’s AAII Investor Sentiment Survey, which reported that 36.8% of individual investors are bullish, while 34.0% are bearish.
The S&P 500 has broken above its recent trading range, as the daily chart shows.
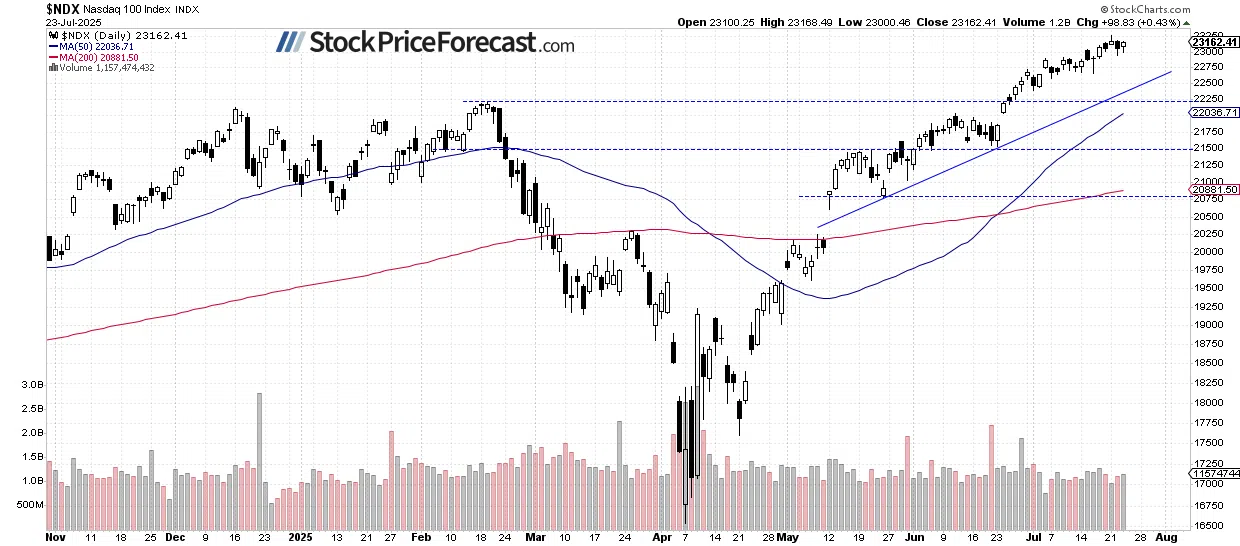
Nasdaq 100 Remained Relatively Weaker
The Nasdaq 100 closed 0.43% higher on Wednesday but underperformed the broader market. It failed to reach a new record high due to weakness in key tech stocks, including Nvidia.
However, this morning, the Nasdaq 100 is expected to gain 0.2% at the open, driven in part by a rebound in GOOG.
While no strong bearish signals have emerged yet, the recent price action may be forming a potential topping pattern.
VIX Dips to New Low
The Volatility Index fell to a new local low of 15.32 yesterday - the lowest since late February - coinciding with stocks hitting new highs. This reflects declining investor fear but also raises the possibility of a short-term market top.
Historically, a dropping VIX indicates less fear in the market, and rising VIX accompanies stock market downturns. However, the lower the VIX, the higher the probability of the market’s downward reversal. Conversely, the higher the VIX, the higher the probability of the market’s upward reversal.

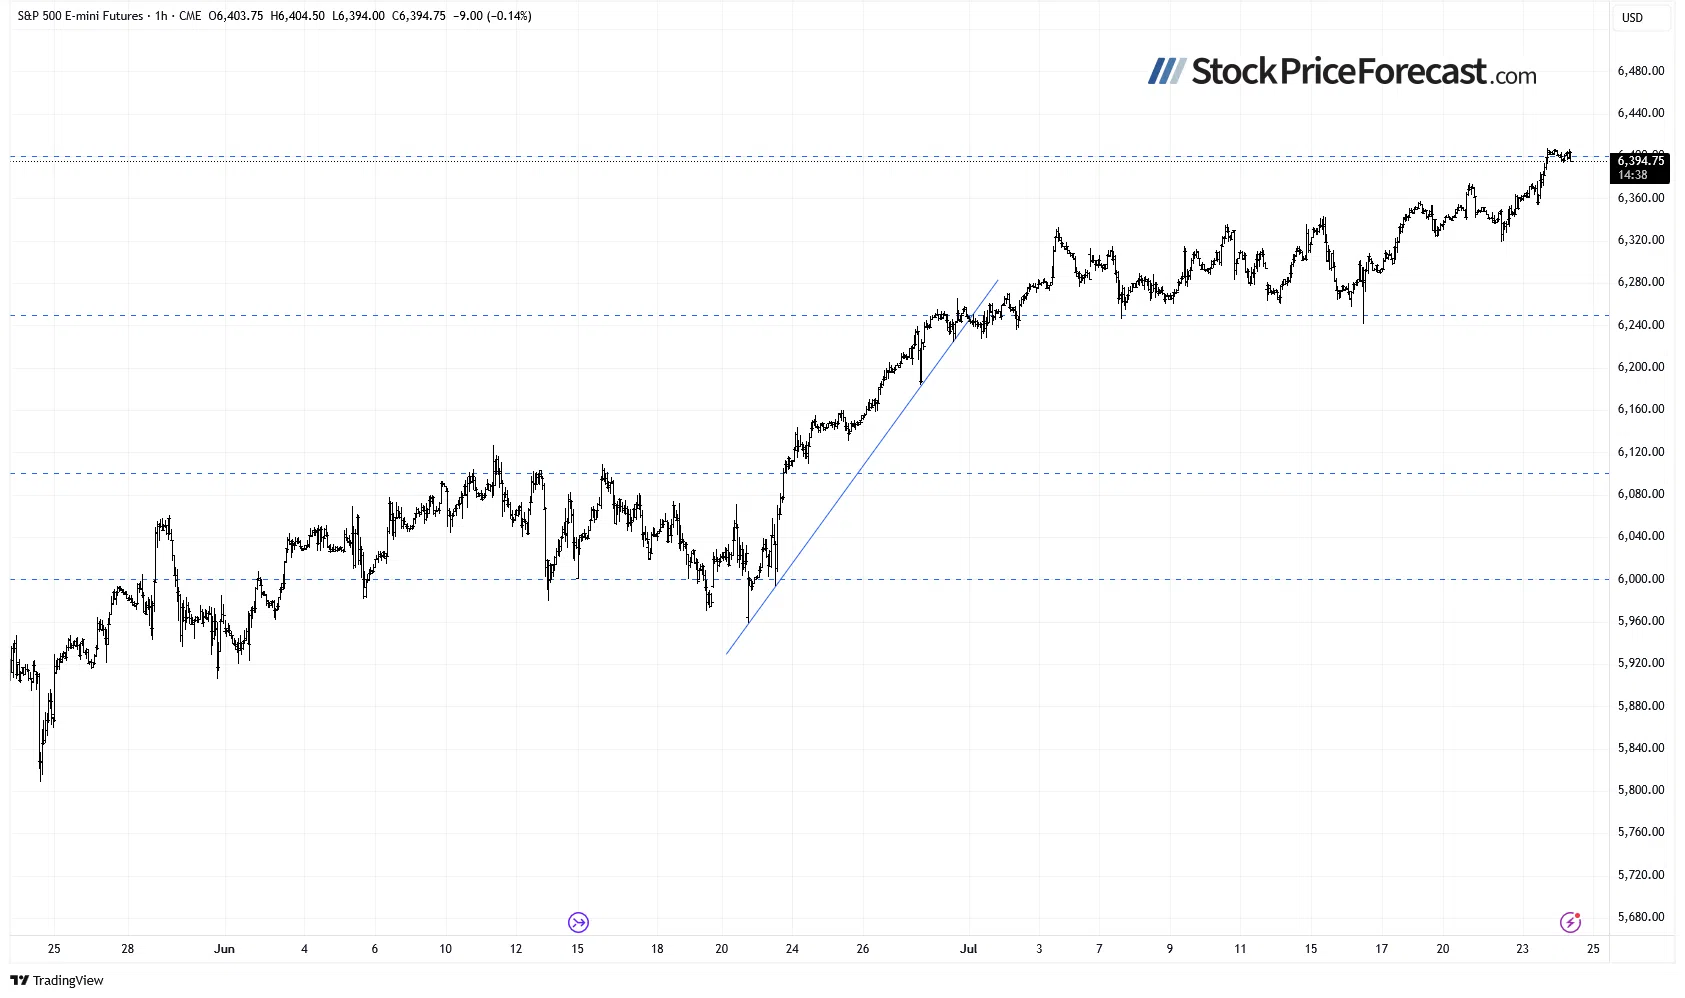
S&P 500 Futures Contract: Uncertainty Following Recent Advances
This morning, the S&P 500 futures contract is trading sideways around the 6,400 level.
While no negative signals have emerged, the market remains within a potential topping formation.
Resistance is now near 6,400-6,410, while support is at 6,350, among others.
Markets remain highly sensitive to tariff-related news and could stay volatile in the near term.
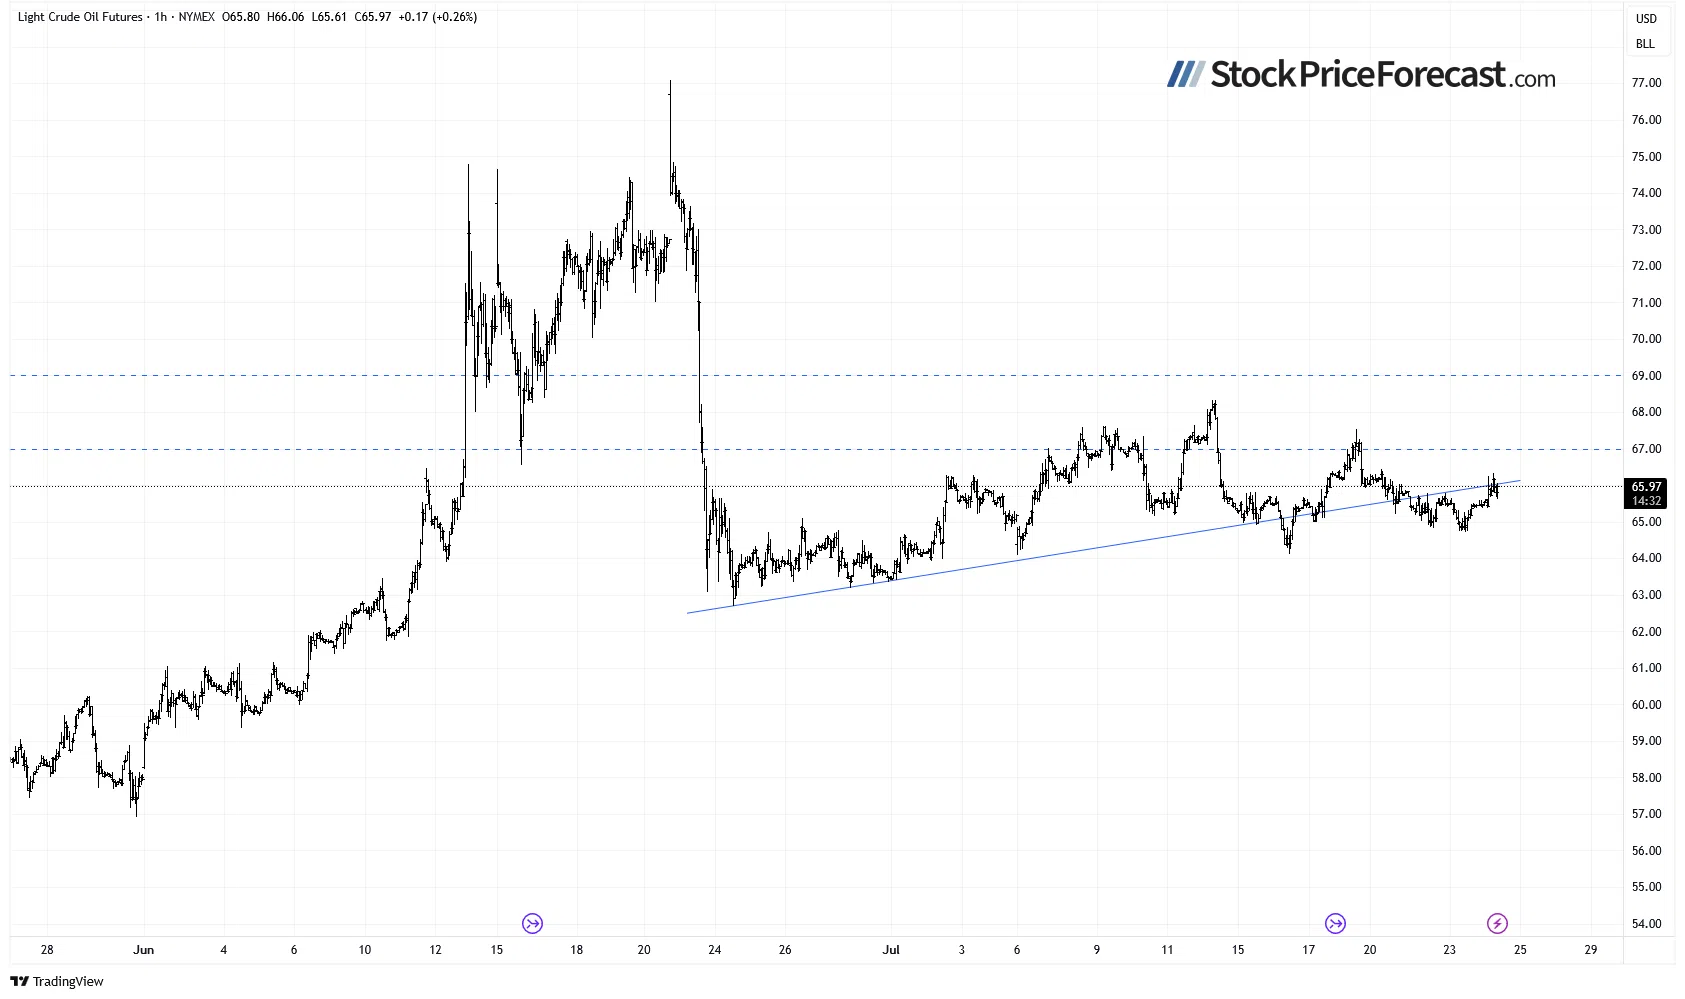
Crude Oil Update: Sideways Trading Continues
Crude oil declined by 0.09% on Wednesday, continuing its consolidation. Mixed economic signals continue to weigh on prices; however, today, oil is up 1.1%, extending its move above the key support level at $65.
For oil markets specifically, these developments are worth monitoring:
- Oil prices are gaining today, driven by stronger-than-expected U.S. crude inventory draws and renewed optimism over U.S. trade negotiations.
- U.S. crude stockpiles fell by 3.2 million barrels, nearly double analysts’ forecasts, signaling tightening supply. Additional support came from disruptions at key export terminals in Turkey and Russia, though those issues were largely resolved.
- Trade deal prospects lifted market sentiment, as U.S.-EU negotiations gained momentum following the recent U.S.-Japan agreement. However, analysts warn that lingering uncertainties over U.S.-China relations and Ukraine-Russia peace talks could cap further gains.
- Analysts expect prices to remain range-bound, with WTI likely fluctuating between $60–$70 per barrel. Attention is now shifting to peak-season demand data, which could impact refining margins and influence price direction.
Oil Rebounds from $65
Crude oil continues to rebound from the $65 support level. For now, the market appears to be in extended consolidation, with resistance around $67–$68.
My short-term outlook on oil remains neutral.
Conclusion
On Thursday, stocks are set to open flat, following Wednesday’s strong rally. The S&P 500 set another record high, slightly accelerating its short-term uptrend.
The key question remains: are these fluctuations a topping pattern or simply an uptrend similar to "climbing a wall of worry"? However, a lack of strong bullish catalysts may limit further upside in the near term.
One of the warning signals that stocks may be approaching at least a short-term top could also be the signal published by Ryan Mitchell in his Seasonal Trading Primer. Someone who opened a position based on this method might soon realize a decent profit, but the signal also suggests that the market may be nearing the end of its short-term move.
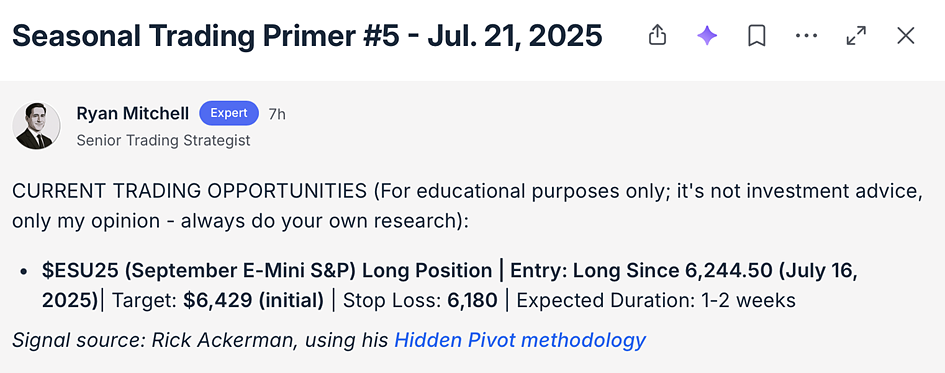
Here’s the breakdown:
- The S&P 500 reached a new all-time high above 6,360.
- The rally extended gains for those who bought based on my Volatility Breakout System.
- There are no clear bearish signals yet, but a deeper downward correction is not out of the question at some point.
The full version of today’s analysis - today’s Stock Trading Alert - includes the additional stock trading ideas and the current S&P 500 position. I encourage you to subscribe and read the details today (with a single-time 7-day free trial). Stock Trading Alerts are also a part of our Diamond Package that includes Gold Trading Alerts and Oil Trading Alerts.
And if you’re not yet on our free mailing list, I strongly encourage you to join it - you’ll stay up-to-date with our free analyses that will still put you ahead of 99% of investors that don’t have access to this information. Join our free stock newsletter today.
Thank you.
Paul Rejczak
Stock Trading Strategist
Recommended for You
- Tax-Optimized Legacy Planning: How Physical Gold IRAs Work in 2025 Learn how forward-thinking investors are protecting generational wealth through tax-advantaged precious metals strategies that function independently of market volatility.
- Volatility Breakout System: Paul's Proprietary Trading Approach Discover how this market-tested trading system has outperformed the S&P 500 by identifying key turning points and generating precise entry signals.