The S&P 500 pulled back yesterday - but is this the start of a correction?
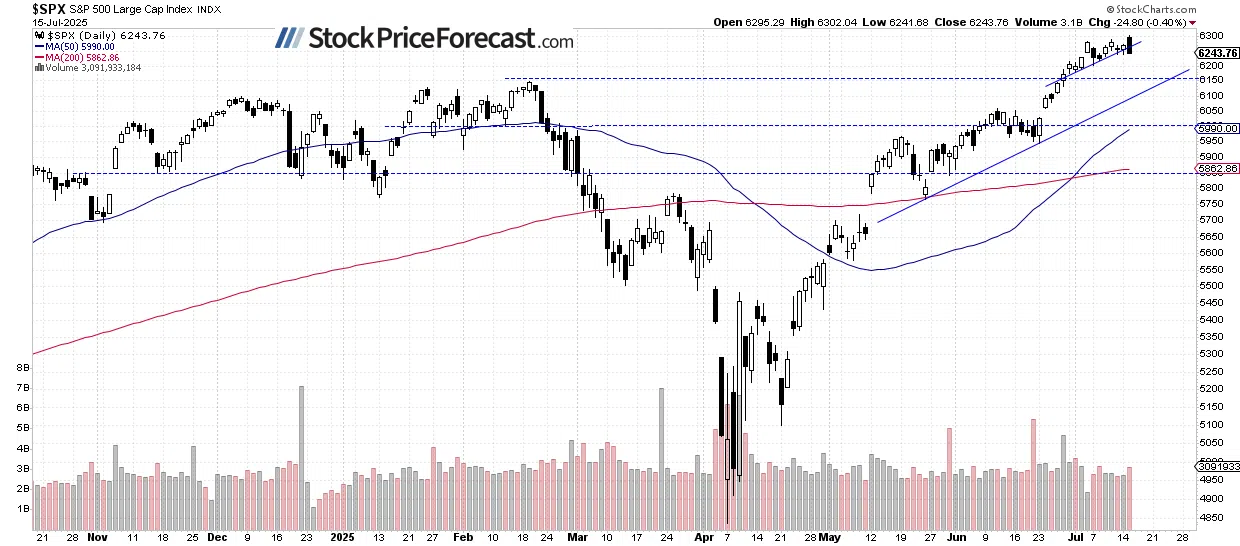
Stock prices pulled back after opening higher on Tuesday, amid mixed news including the CPI release, Nvidia’s China chip news, and earnings reports. The S&P 500 closed 0.40% lower after hitting a new record high of 5,302.04.
This morning, the S&P 500 is expected to open 0.2% lower; however, it has retraced most of its overnight weakness. The Producer Price Index (PPI) came in flat at 0.0% month-over-month, below the expected +0.2%.
Investor sentiment remains elevated, as reflected in the last Wednesday’s AAII Investor Sentiment Survey, which reported that 41.4% of individual investors are bullish, while 35.6% are bearish.
The S&P 500 continues to hover near record highs, as the daily chart shows.
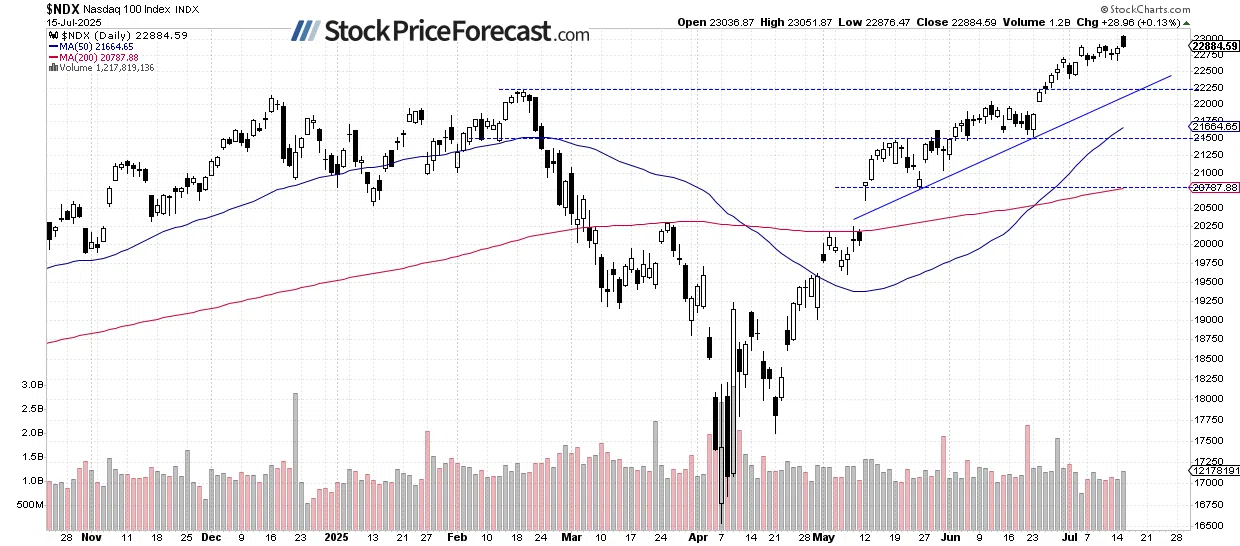
Nasdaq 100: New Record and a Pullback
The Nasdaq 100 reached a new all-time high of 23,051.87 but closed just 0.13% higher after pulling back.
While no strong bearish signals have emerged yet, the recent price action may be forming a potential topping pattern.
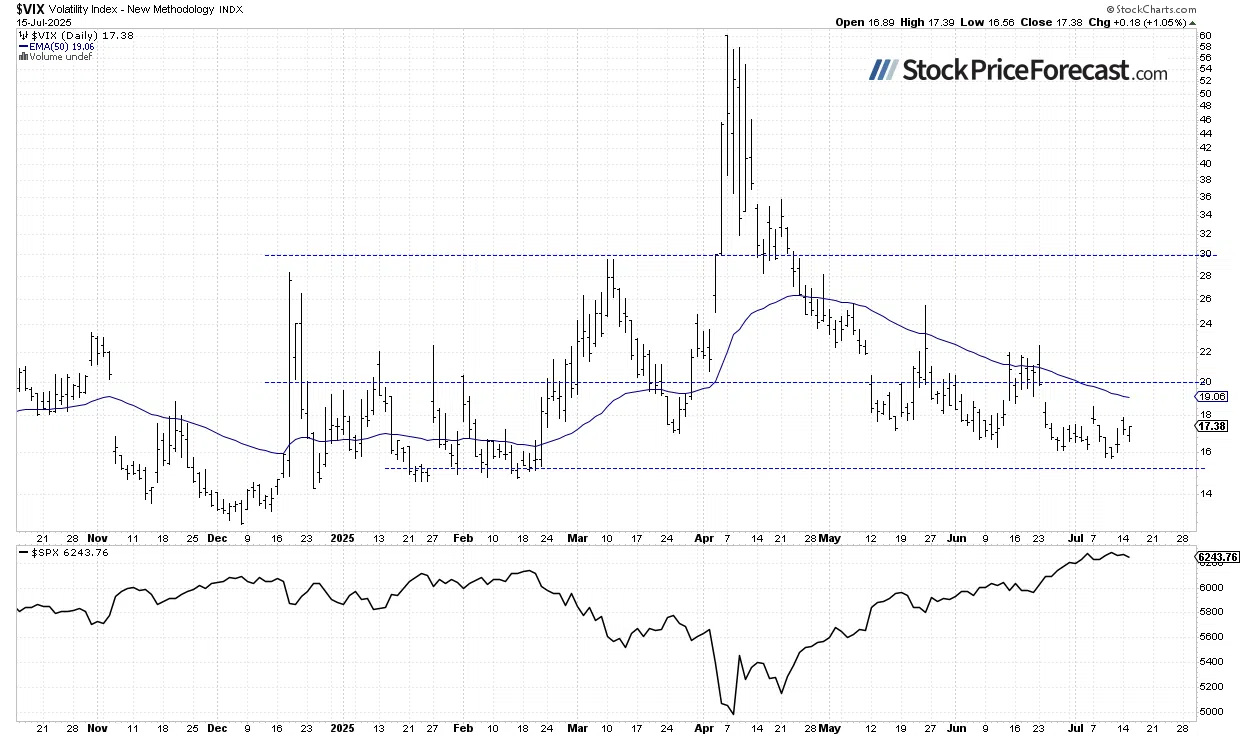
VIX: Extending Fluctuations
The Volatility Index (VIX) dropped to a local low of 15.70 on Thursday, signaling continued strength in equities. On Monday, however, the VIX rebounded to a high of 17.85 despite relatively calm market action.
Historically, a dropping VIX indicates less fear in the market, and rising VIX accompanies stock market downturns. However, the lower the VIX, the higher the probability of the market’s downward reversal. Conversely, the higher the VIX, the higher the probability of the market’s upward reversal.
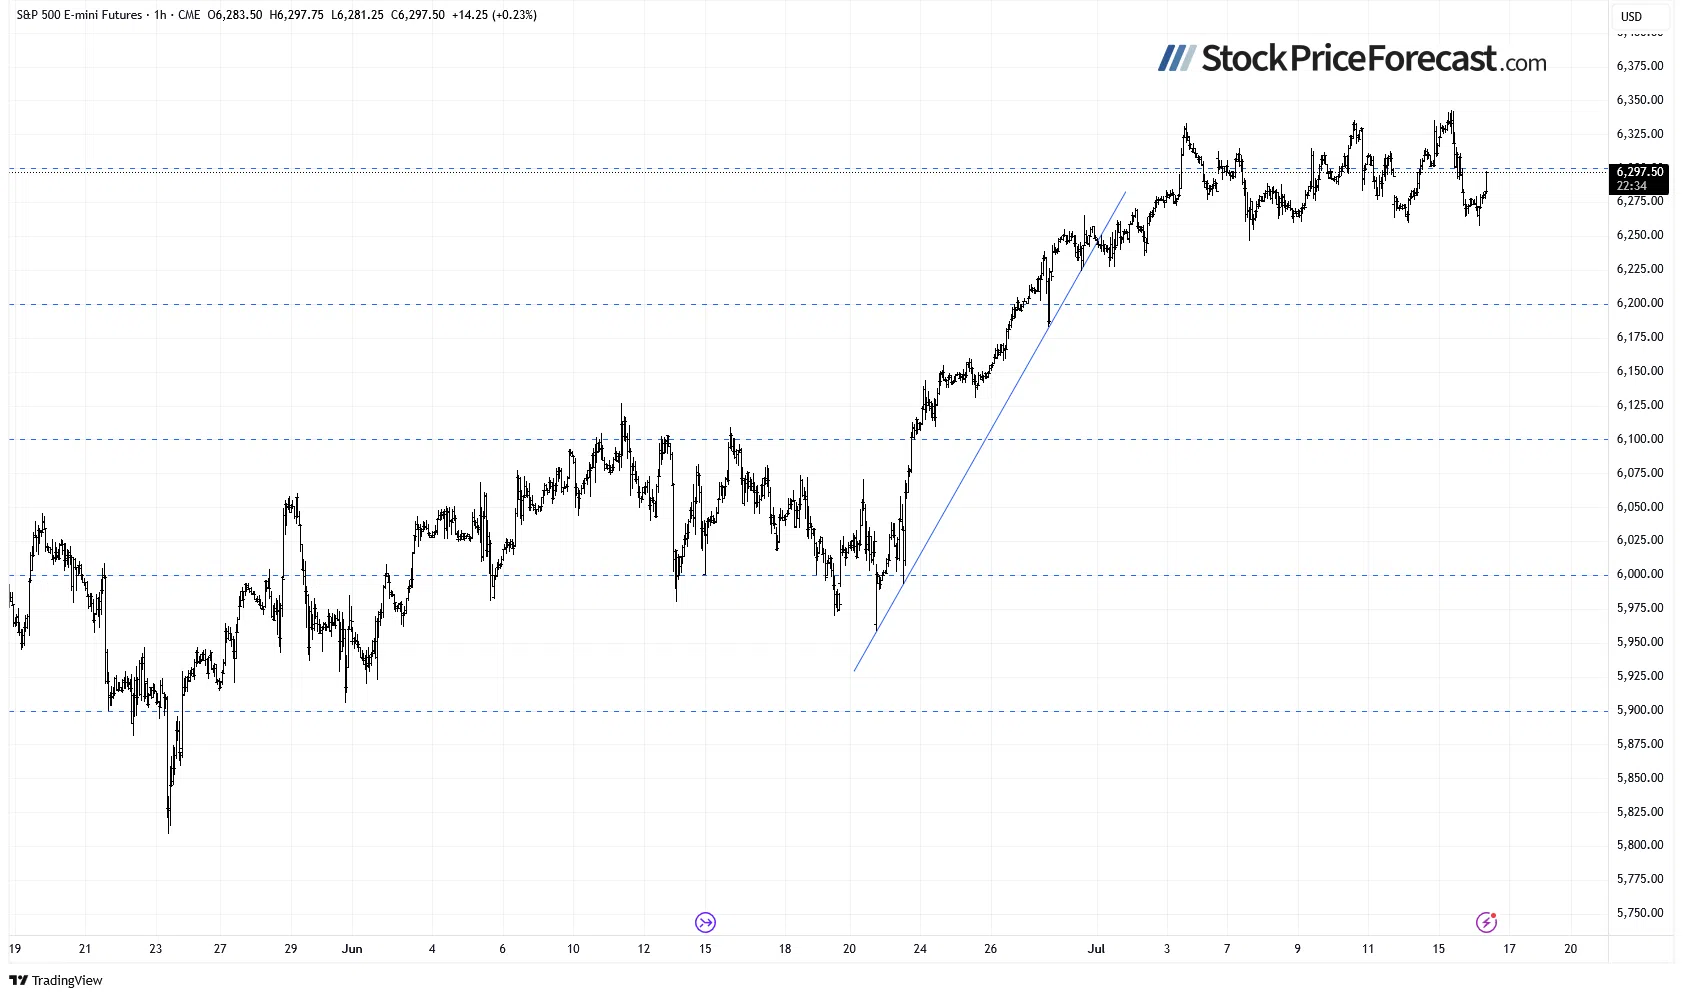
S&P 500 Futures Contract: Still Near 6,300
This morning, the S&P 500 futures contract is trading near 6,300, extending a short-term consolidation after pulling back from a new record.
Despite this new high, the index remains in a consolidation - potentially forming either a topping pattern or a flat correction before a possible next leg higher.
Resistance is near 6,300-6,320, while support is around 6,260.
Markets remain highly sensitive to geopolitical developments and could stay volatile in the near term.
Crude Oil Update: Continuing Decline
Crude oil fell 0.69% on Tuesday following Monday’s 2.2% loss. On Friday, it pulled back from the key $70 level, reinforcing that level as psychological resistance. Today, oil is down another 1.0%, hitting new local lows.
For oil markets specifically, these developments are worth monitoring:
- Barclays reports China’s oil demand is resilient, averaging 17.2 million barrels per day (bpd) in H1 2025 - up from 16.8m bpd in 2024 and 14.1m bpd in 2019.
- Oil prices are under pressure as optimism about Chinese demand is offset by concerns over U.S. tariffs.
- Chinese refiners are increasing output post-maintenance to meet rising fuel demand, while OPEC expects a stronger global economy in H2 2025, especially in Brazil, China, and India.
Oil: Below the Trend Line
Crude oil continues its short-term downtrend, breaking below its recent upward trend line.
Resistance is now around $67, with potential support near $65.
My short-term outlook on oil remains neutral.

Conclusion
The S&P 500 is expected to open 0.2% higher, despite overnight weakness and Tuesday’s pullback from record highs. For now, the index appears to be in short-term consolidation.
With tariff-related news still circulating, investor focus will shift toward the start of earnings season.
Here’s the breakdown:
- The S&P 500 remains in consolidation ahead of corporate earnings reports.
- The recent rally extended gains for those who bought based on my Volatility Breakout System.
- There are no clear bearish signals yet, but a deeper downward correction is not out of the question at some point.
The full version of today’s analysis - today’s Stock Trading Alert - includes the additional stock trading ideas and the current S&P 500 position. I encourage you to subscribe and read the details today (with a single-time 7-day free trial). Stock Trading Alerts are also a part of our Diamond Package that includes Gold Trading Alerts and Oil Trading Alerts.
And if you’re not yet on our free mailing list, I strongly encourage you to join it - you’ll stay up-to-date with our free analyses that will still put you ahead of 99% of investors that don’t have access to this information. Join our free stock newsletter today.
Thank you.
Paul Rejczak
Stock Trading Strategist
Recommended for You
- Tax-Optimized Legacy Planning: How Physical Gold IRAs Work in 2025 Learn how forward-thinking investors are protecting generational wealth through tax-advantaged precious metals strategies that function independently of market volatility.
- Volatility Breakout System: Paul's Proprietary Trading Approach Discover how this market-tested trading system has outperformed the S&P 500 by identifying key turning points and generating precise entry signals.