With market volatility at the forefront, are you prepared to navigate critical S&P and NASDAQ levels this week?
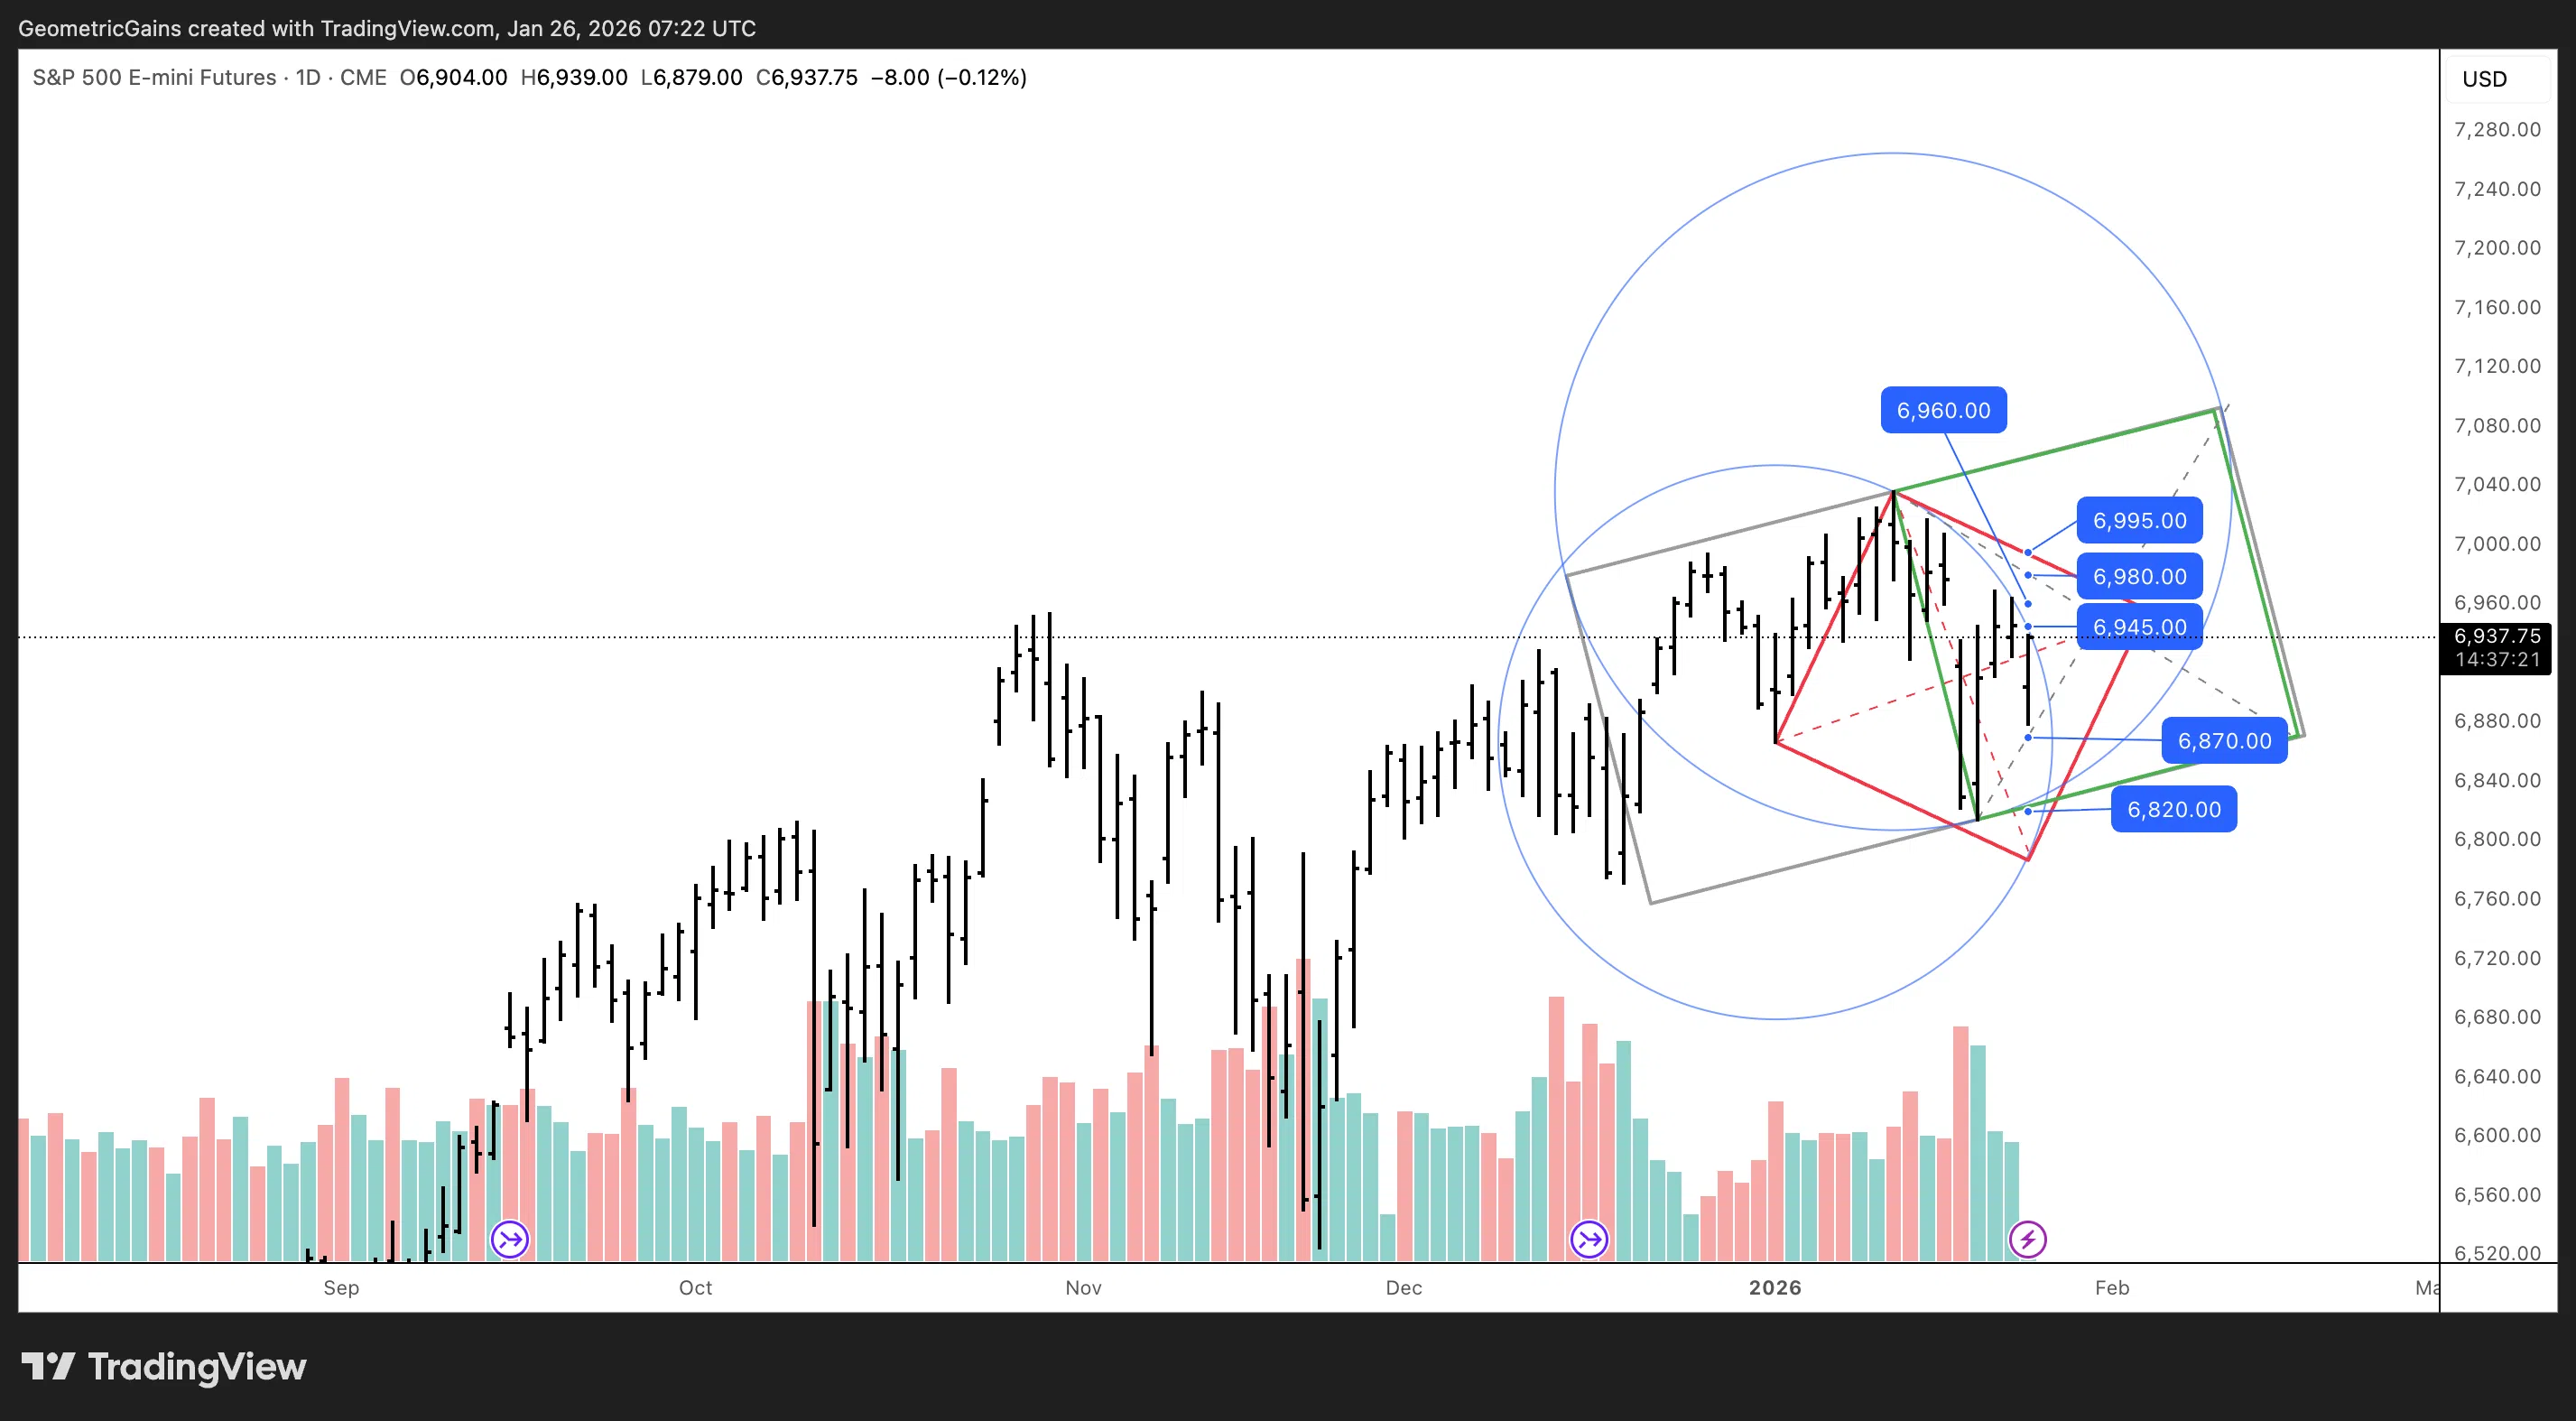
S&P UPDATE
Once again on Friday we marked the exact high between 6,960–6,980, where we advised going short. As expected, the market opened with a gap down this morning and found support precisely at the diagonal of the extended volatility area at 6,875 (green square). Unfortunately, this move occurred overnight, so not everyone may have been able to take profits.
For today, the key level to watch is 6,945, just below our internal volatility area, defined by the circumference that has so far acted as perfect resistance.
- If 6,945 is broken, the next resistance zone is 6,980–6,995, where we will look to sell again.
We continue to expect range-bound trading for now and maintain our view that a major drop is likely between mid-February and the end of March. Until then, continue trading the range within our red square volatility area.
- Main support: 6,870
- More critical support: 6,820
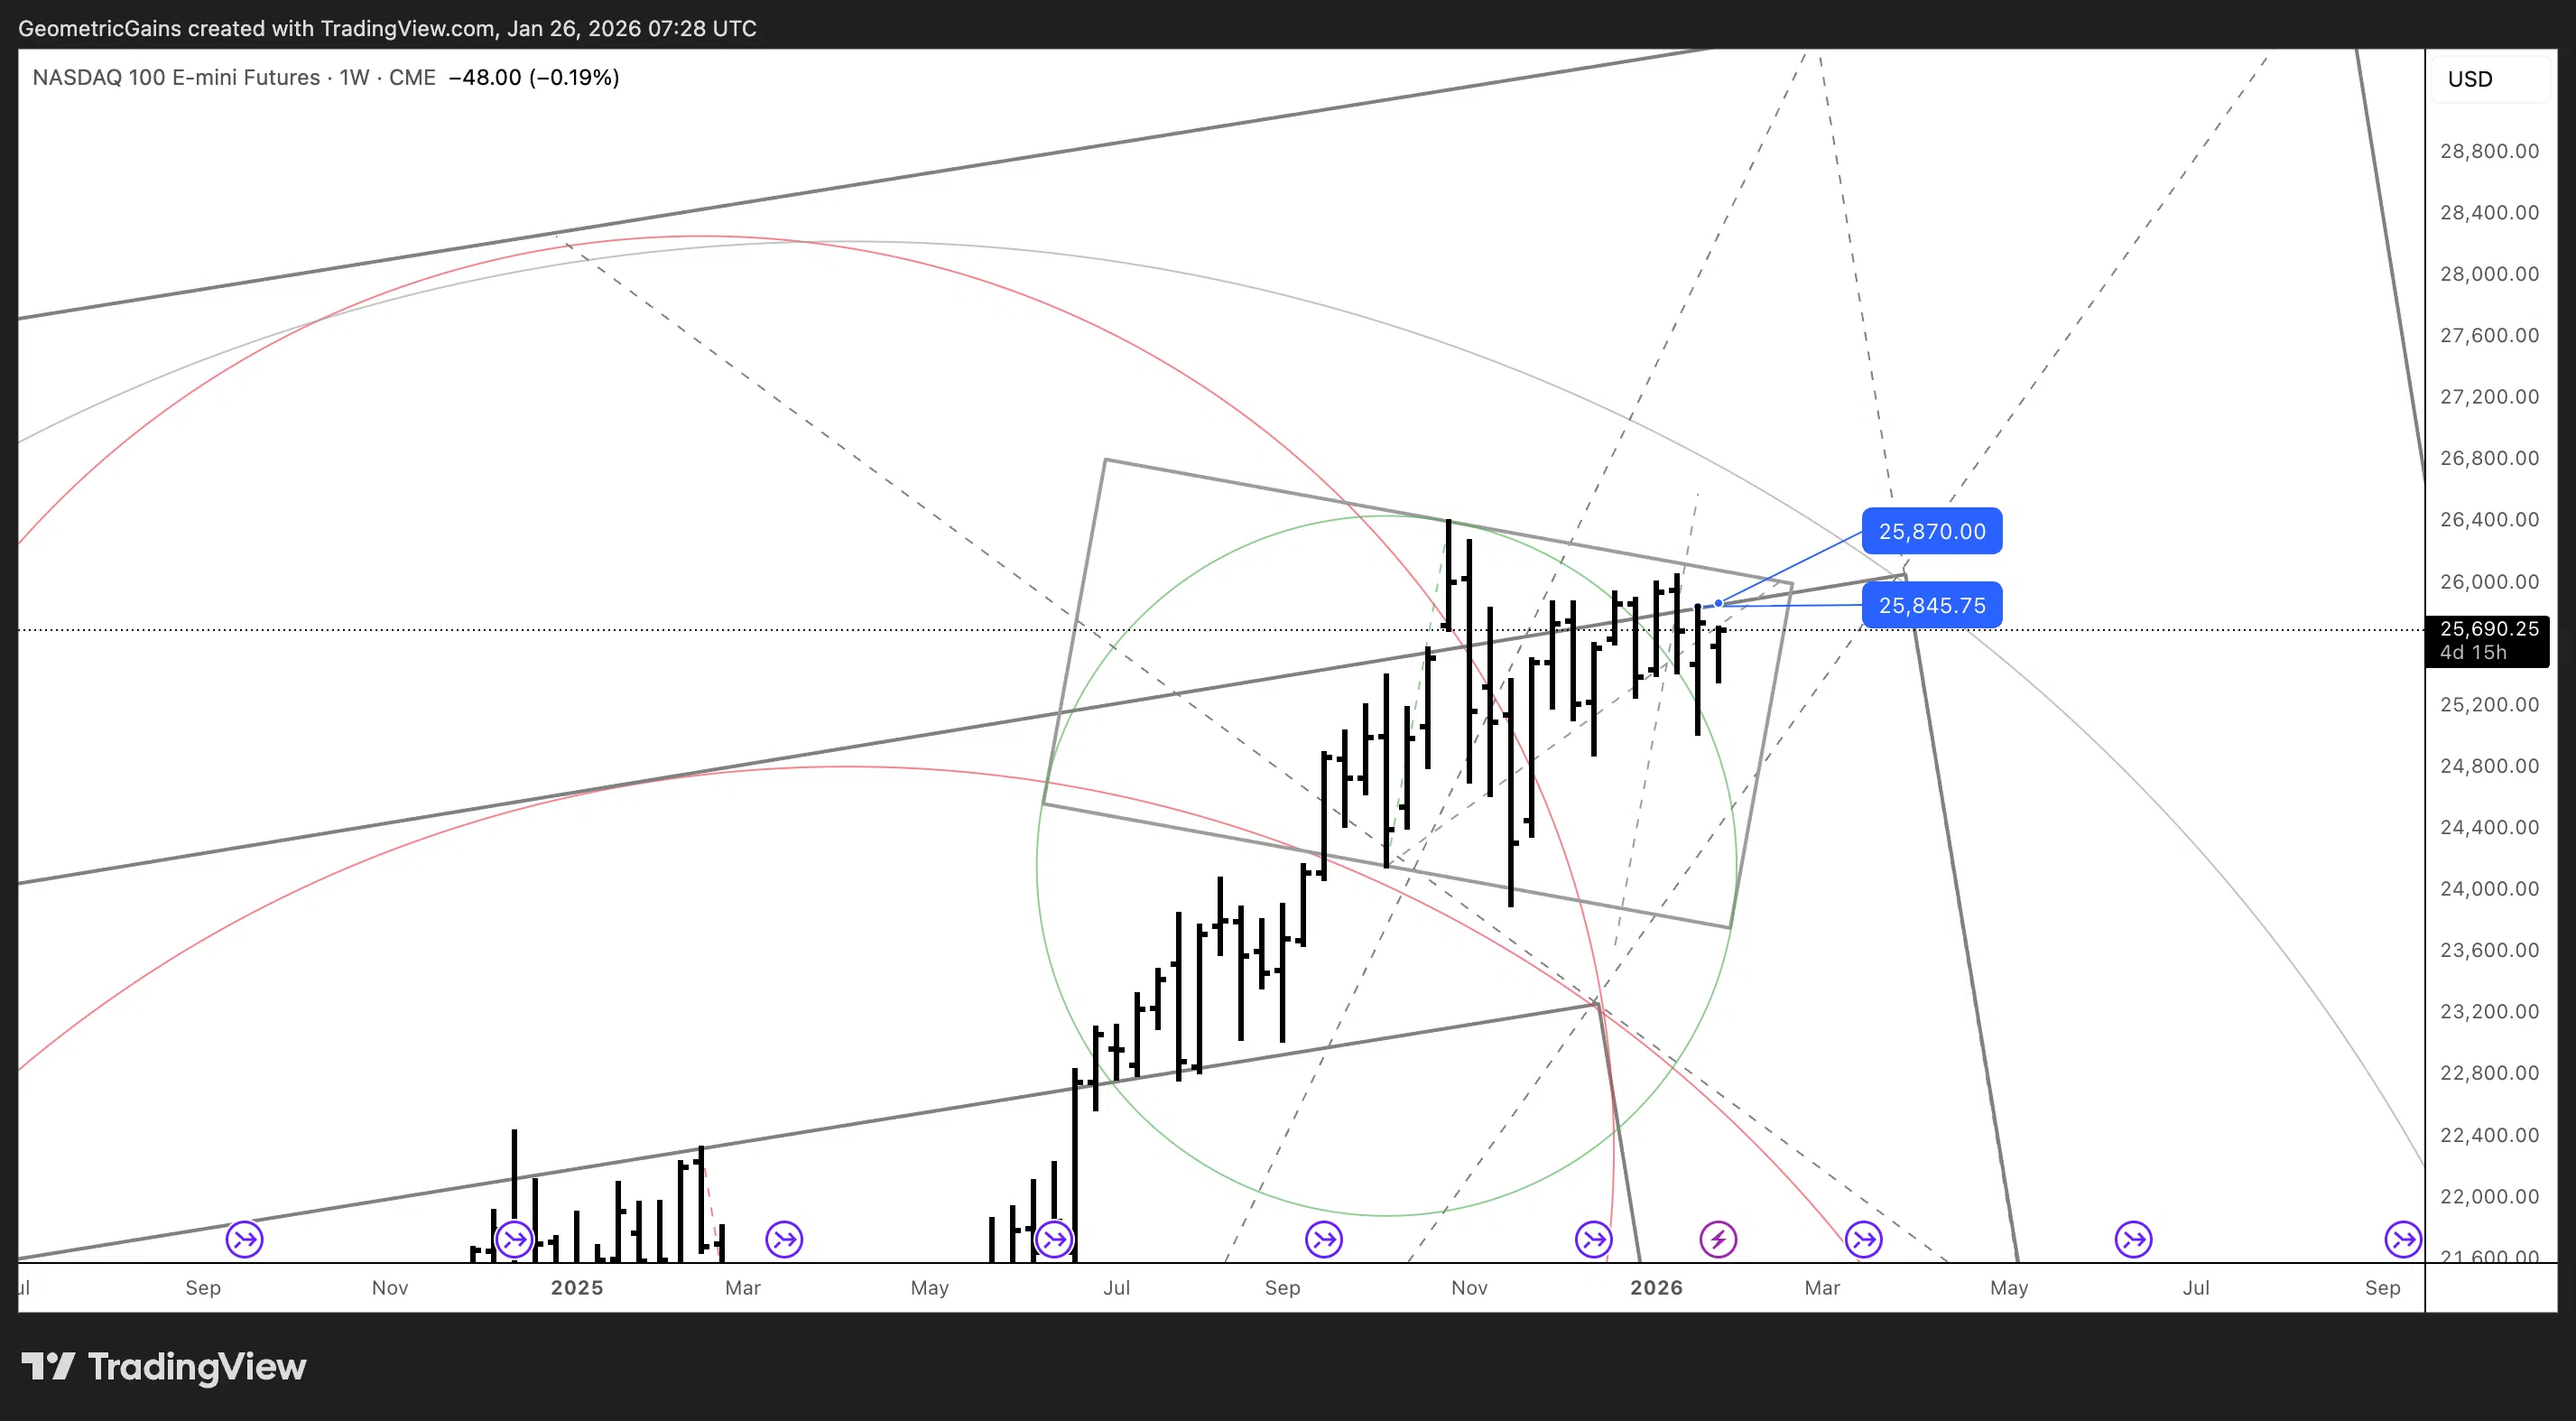
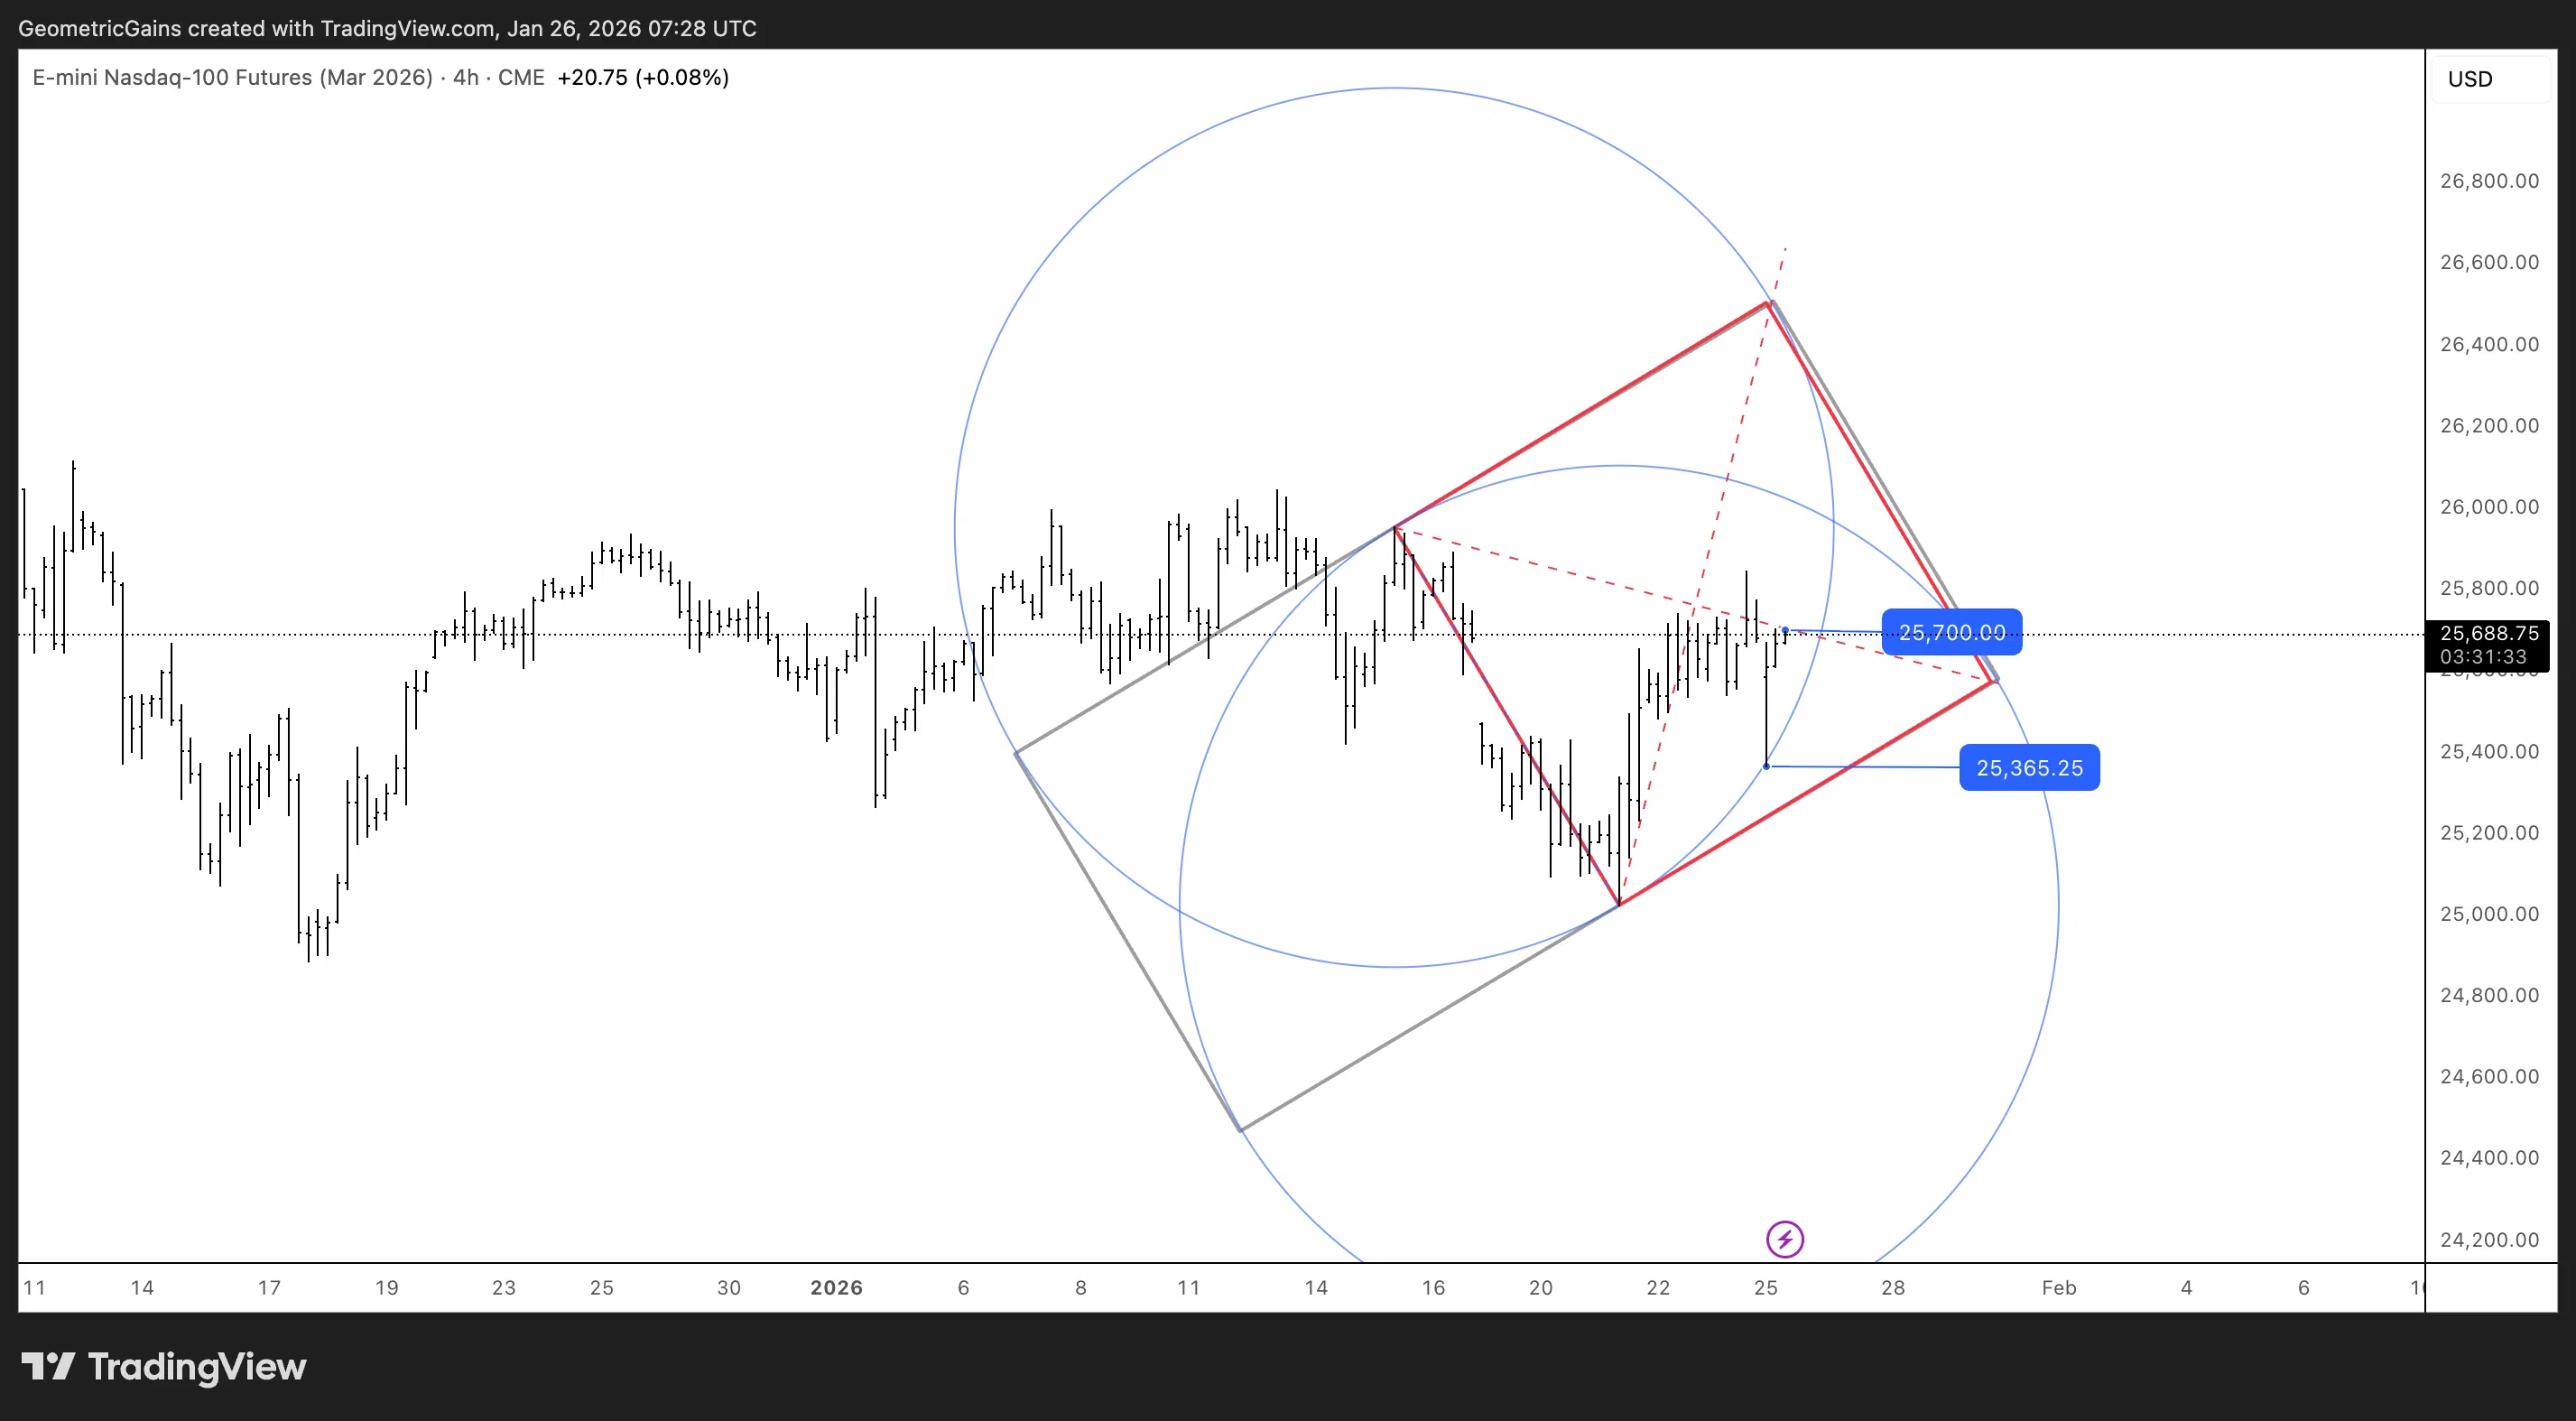
NASDAQ UPDATE
Once again, we managed to identify the top on Friday at around 25,850. This morning, price found support near 25,300, and hopefully some of you were able to book partial or full profits on the move lower.
For today, resistance is located between 25,700–25,870.
If trading from the short side, always maintain a stop at 26,150 on a daily closing basis.
The ideal area to cover shorts is between 25,000–24,900. Should we reach this zone, we will also look for long opportunities from there.